A containerized approach to software deployment means you can deploy at scale without having to worry about the configuration of each unit. In Kubernetes, clusters do the heavy lifting for you—they’re the pooled resources that run the pods that hold your individual containers.
You can divide each cluster by namespace, which allows you to assign nodes (ie the machine resources in a cluster) to different roles or different teams. Resource quotas limit what each namespace can use. Restrictions on things like CPU usage, memory, storage, requests, and object creation prevent resource hogging. You can force the elements of your system to work within boundaries that you control.
So let’s talk about how to work with resource quotas. You’ll learn how to figure out what resources you need, how to set ranges for acceptable use, and how to detect and respond to common problems. You’ll also learn best practices so you can make the right decisions about imposing limits.
Identifying the Source of Resource Constraints
Understanding how your resources are used is key to allocating them effectively. The right tools can give you a detailed picture of your clusters and what’s going on inside them. You can see which tasks are the most resource-intensive and then respond to any overuse.
In addition to knowing how the nodes in a cluster are working, you also need to know what’s going on in individual pods and containers.
Using Tools to Get Information
Tools like kubectl, kubectl top, and Prometheus can deliver better observability into your container orchestration.
kubectl is a key part of any Kubernetes developer’s toolbox. You can use it to create namespaces and then apply resource quotas to them.
The quotas are defined in `.yaml` files. Apply these files to namespaces with lines like `kubectrl apply -f your-file.yaml`, and then view the results with the `describe` command.
kubectl top is a useful command to know. You can use it to quickly get information on resource usage.
For example, you can use `kubectl top node` to get metrics for all nodes. By default, that includes your total memory and number of CPU cores, along with the percentage of each that you’re using. `kubectl top pod` shows you the resource consumption of pods. You can break that info down further by namespace, using `kubectl top pod –namespace=FOO` to provide more specific data.
Before using kubectl top, you need to install the [metrics server], which isn’t available by default. If you see an error message, like Metrics API not availableת when using kubectl top commands, you know the metric server isn’t currently installed.
Prometheus is one of the most popular monitoring tools around and can be configured to collect all kinds of metrics. Together with the Kubernetes REST API, you can use it to show what’s going on in any particular namespace within your clusters.
Prometheus queries can give you a quick overview of which containers are running without limits and which are pushing against their constraints. For example, this query will show you if any are close to using their whole CPU quota:
``` Prometheus

(sum by

(namespace,pod,container)(rate(container_cpu_usage_seconds_total{container!=""}[5m])) /

sum by(namespace,pod,container)(kube_pod_container_resource_limits{resource="cpu"})) > 0.9

```
Set up Prometheus to give you a general overview of your resource usage or configure it to focus on critical areas. Let’s say that memory is the bottleneck for your system—displaying related stats can help you spot where the issues are coming from.
You can use Kubernetes metrics like `kube_pod_container_resource_requests{resource="memory"}` and `kube_pod_container_resource_limits{resource="memory"}` to get information on limits and requests, and `container_memory_working_set_bytes` to track your memory usage. You can also compare memory requests and memory limits to actual usage to make sure you’re not asking for more resources than you really need.
Visualizing usage helps you spot problems early, letting you respond to issues before they get too serious.
Analyzing Resource Utilization and Consumption Patterns
To determine what’s going on in your nodes, pods, and clusters, run kubectl queries. You can get some basic information on node status by running the following line in kubectl:
``` command line

kubectl get nodes --show-labels

```
While it’s extremely useful, kubectl does require some expertise. Figuring out exactly how to find the information you need can be a barrier. You might find tools like Komodor more accessible, providing information that you might struggle to extract using kubectl alone.
Setting Resource Quotas and Improving Utilization
To make full use of your resources, make sure each element of your cluster has what it needs and no more. Let’s first take a look at the effect resource quotas can have on a system, and then you’ll see how to set them correctly.
Understanding How Resource Limits and Requests Affect Your Cluster
Quotas prevent your clusters from being overwhelmed by a particular node, pod, or container that’s consuming excess resources. On the flip side, quotas can also prevent a node from taking all the resources it may require. If a node is dealing with CPU tasks that need more time than it’s been allocated, for example, the tasks will take longer to complete.
Obviously, you need to aim for the right balance of values when you set your resource quotas. Your general goal is to avoid destabilization from overconsumption while keeping tasks moving at a decent pace. And in order to do that, you need to know what resources are required during normal use and during activity spikes. Don’t forget to account for situations that can lead to dramatic changes in traffic, like peak times of year for your business, advertising campaigns, or your app getting some attention in the media. Tools like Prometheus, which we talked about earlier, can track usage over time so you can more easily see your true limits.
Still, setting the right limits is an art, not a science. Start by understanding your existing data, and then consider what circumstances could make those numbers change.
Setting Resource Limits and Requests for Namespaces, Pods, and Containers
You can set resource quotas for namespaces, pods, and containers. They’re all defined via YAML files.
Here’s an example from Kubernetes’s documentation:
``` YAML

apiVersion: v1

kind: ResourceQuota

metadata:

  name: compute-resources

spec:

  hard:

requests.cpu: "1"

requests.memory: 1Gi

limits.cpu: "2"

limits.memory: 2Gi

requests.nvidia.com/gpu: 4

```
This file includes both limits and requests. The limits are maximums; the container will not be allowed to exceed these. Requests are minimum values; the Kubernetes scheduler will make sure these are always available to the container.
In this case, you’re guaranteed the use of one CPU core, with up to two available on request. You’ll get at least 1 GB of memory, up to 2 GB.
Resource quotas can have specific scopes. For example, you can specify limits that apply to pods of a specific priority. Perhaps high-priority pods need extra CPU resources, so you give them higher limits than others.
Again, you need to use both data and your own contextual knowledge to choose the right values.
Best Practices for Resource Utilization
Easier said than done, right? Still, there are ways to make this art more scientific:
📊 Don’t set limits too low. If a container doesn’t have enough resources, Kubernetes will destroy it.
📊 Don’t set limits too high. If you’re not allocating resources effectively, you’re wasting them.
📊 Different resources for different roles Kubernetes allows you to limit resources by namespace. You can afford to consider the different tasks nodes are performing and allocate resources accordingly.
📊 Use all your options Don’t stop at setting quotas for memory and CPU. You can set limits for storage, object counts, and more. Don’t forget to specify minimums and maximum values, or even ranges for different kinds of resources.
📊 Monitor and tune your limits If you keep an eye on your resource usage and logs, you can spot when containers are killed. Often, it’s a sign that they need more resources. However, if things are running smoothly, you might be able to tighten your limits and save some money. Keep an eye on the gap between what you’ve actually used and the resources you’ve allocated.
Each of these practices is about finding the right balance. Tooling can take out a lot of the guesswork, like using Komodor to easily identify which services are causing problems.
Using Komodor to Debug Node-level Issues
In order to solve node-level issues, you have to understand the relationships between the node and the elements of its cluster. As mentioned earlier, kubectl can get you information on nodes, and Prometheus can visualize the data for you. However, you can extract insight more readily than that with tools like Komodor.
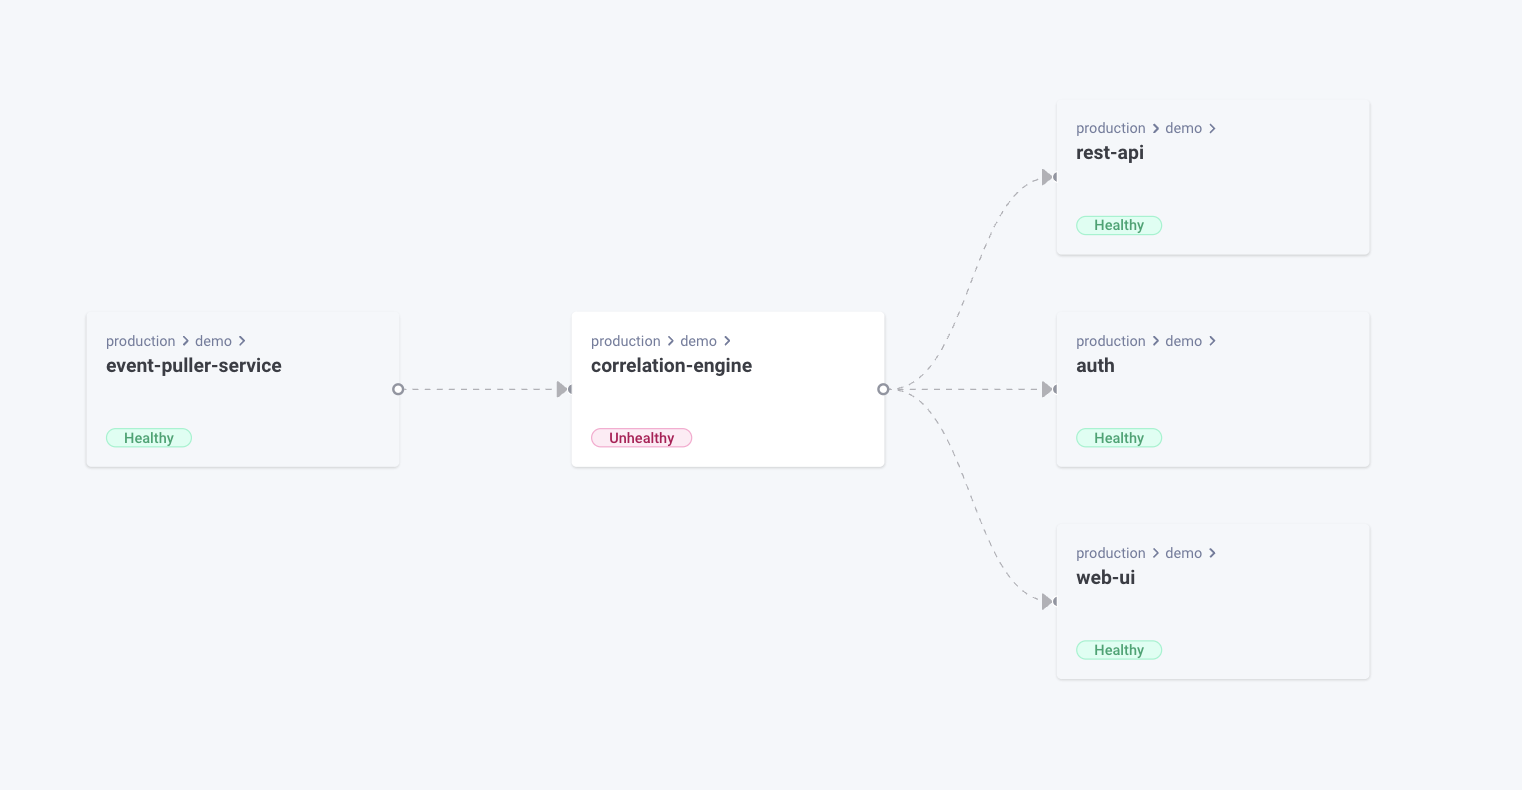
Komodor’s Node Status view is designed specifically to show you how your nodes interact. At a glance, you can see the limits and capacity settings of each node. You can easily determine which nodes are consuming too many resources, affecting their neighbors, or have health issues that are impacting services.
Once you’ve identified a problem node, you can see whether specific pods or containers are causing issues. Adjust their resource allocations, and then track changes to see if a particular tweak is responsible for your issues.
Historical data is easy to view in Komodor, which makes fixing performance problems much easier. Perhaps an issue has been building for a while before becoming noticeable; you can trace its origins to isolate the fix.
Get alerts about network problems, memory shortages, too many running processes, or issues with disk capacity from Komodor’s monitors. Monitors are triggered by nodes with faulty conditions, so you can quickly investigate the issue and determine how to solve the problem. You also have options for how to receive those alerts. Komodor integrates with multiple communication channels, such as Slack, for example.
Conclusion
Resource quotas help your nodes operate in harmony. Setting limits on what they consume means your clusters are more stable and run more efficiently. But getting the values right is the tough part.
You have to learn what resources your clusters need to run effectively. Monitor your systems to figure out how and when consumption varies. You’ll probably need to experiment a bit before you can pinpoint how to squeeze the most from your resources.
Komodor gives you the observability you need to do that. Observe exactly how your nodes interact, and you can deliver smoothly running applications while minimizing costs.
If you need help with Kubernetes, join the Komodor Slack Kommunity. We’re here to help with all your Kubernetes needs. Let’s get your pods working in harmony, so you can deliver the best apps to your users.