What is Kubernetes 502 Bad Gateway?
A 502 Bad Gateway error is an 5xx server error that indicates a server received an invalid response from a proxy or gateway server. In Kubernetes, this can happen when a client attempts to access an application deployed within a pod, but one of the servers responsible for relaying the request—the Ingress, the Service, or the pod itself—is not available or not properly configured.
It can be difficult to diagnose and resolve 502 Bad Gateway messages in Kubernetes, because they can involve one or more moving parts in your Kubernetes cluster. We’ll present a process that can help you debug the issue and identify the most common causes. However, depending on the complexity of your setup and the components failing or misconfigured, it may be difficult to identify and resolve the root cause without proper tooling.
How to Debug 502 Bad Gateway in Kubernetes
Consider a typical scenario in which you map a Service to a container within a pod, and the client is attempting to access an application running on that container. This creates several points of failure:
- The pod
- The container
- Network ports exposed on the container
- The Service
- The Ingress
Here are the basic steps to debugging a 502 error in a Kubernetes pod, which aims to identify a problem in one or more of these components.
Related content: Read our guide to the Kubernetes service 503 error
1. Check if the Pod and Containers is Running
If the pod or one of its containers did not start, this could result in a 502 error to clients accessing an application running in the pod.
To identify if this is the case, run this command:
$ kubectl get pods
- If the entire pod or the required containers are not running—restart the pod or force Kubernetes to reschedule it.
- If they are running—proceed to the next step.
2. Check if Containers are Listening on the Required Port
Identify what address and port the Service is attempting to access. Run the following command and examine the output to see whether the container running the application has an open port and is listening on the expected address:
kubectl describe pod [pod-name]
- If you see the container is not listening on the port—check the pod specification. If the pod specification does not specify the port in the spec:containers:ports field, add it. If it does specify the port, but it was not opened for some reason, restart the pod.
- If the container is listening on the required post—proceed to the next step.
3. Check if the Service Is Active
If the pod and containers are running and listening on the correct port, the next step is to identify if the Service accessed by the client is active. Note there might be different Services mapped to different containers on the pod.
Run this command:
kubectl get svc
- If you don’t see the required Service in the list—create it using the
kubectlexpose command. - If you see it in the list—proceed to the next step.
4. Check if the Service is Mapped Correctly
A common issue is that the Service is not mapped to the pod exposed by your container. You confirmed previously that a container on your pod exposes a certain port. Now check if the Service maps to this same port.
Run this command:
kubectl describe svc [service-name]
A healthy service should produce output like this, showing the port it is mapped to:
Name:                my-nginx
Namespace:           default
Labels:              run=my-nginx
Annotations:         none
Selector:            run=my-nginx
Type:                ClusterIP
IP:                  10.0.162.149
Port:                unset 80/TCP
Endpoints:           10.244.2.5:80,10.244.3.4:80
Session Affinity:    None
Events:              none
- If the Service is mapped to a different port—shut it down using the command
kubectl stop -f [service-name], change the service specification to map to the correct port, and recreate it usingkubectl expose. - If the Service is already mapped to the correct port—proceed to the next step.
5. Check if Ingress Exists
If the Service is healthy, the problem might be in the Ingress. Run this command:
get ing
Check the list to see that an Ingress is active specifying the required external address and port.
- If there is no Ingress specifying the address and port—create one. Define an Ingress specification and run it using
kubectl apply -f [ingress-config].yaml. - If the Ingress exists—proceed to the next step.
6. Check Ingress Rules and Backends
An Ingress contains a list of rules matched against incoming HTTP(S) requests. Each path is matched with a backend service, defined with a service.name and either port name or number to access the service.
Run the following command to see the rules and backends defined in the Ingress:
kubectl describe ingress [ingress-name]
The output for a simple Ingress might look like this:
Name:             test
Namespace:        default
Address:          178.91.123.132
Default backend:  default-http-backend:80 (10.8.2.3:8080)
Rules:
  Host                 Path  Backends
  ----                 ----  --------
  dev.example.com      /*    service1:80 (10.8.0.90:80)
  Staging.example.com  /*    service2:80 (10.8.0.91:80)

Annotations:
  nginx.ingress.kubernetes.io/rewrite-target:  /

Events:
  Type     Reason  Age   From                     Message
  ----     ------  ----  ----                     -------
  Normal   ADD     45s   loadbalancer-controller  default/test
There are two important things to check:
- The host and path accessed by the client is mapped to the IP and address on the Service.
- The backend associated with the Service is healthy.
A backend could be unhealthy because its pod does not pass a health check or fails to return a 200 response, due to an application issue. If the backend is unhealthy you might see a message like this:
ingress.kubernetes.io/backends:
{"k8s-be-97862--ee2":"UNHEALTHY","k8s-be-86793--ee2":"HEALTHY","k8s-be-77867--ee2":"HEALTHY"}
- If the Ingress is not correctly mapped or unhealthy—fix the Ingress specification and deploy it using
kubectl apply -f [ingress-config].yaml. - If you still cannot find any issue—the problem is probably with your application. Look for application logs or messages that might indicate an error. Bash into your container and identify if the application is working.
This procedure will help you discover the most basic issues that can result in a 502 bad gateway error. If you didn’t manage to quickly identify the root cause, however, you will need a more in-depth investigation across multiple components in the Kubernetes deployment. To complicate matters, more than one component might be malfunctioning (for example, both the node and the Service), making diagnosis and remediation more difficult.
Solving Kubernetes Node Errors with Komodor
Kubernetes troubleshooting relies on the ability to quickly contextualize the problem with what’s happening in the rest of the cluster. More often than not, you will be conducting your investigation during fires in production.
The major challenge is correlating service-level incidents with other events happening in the underlying infrastructure. 502 Bad Gateway is an error that can occur at the conatiner, pod, service, or Ingree level, and can also represent a problem with the ingress or the underlying nodes.
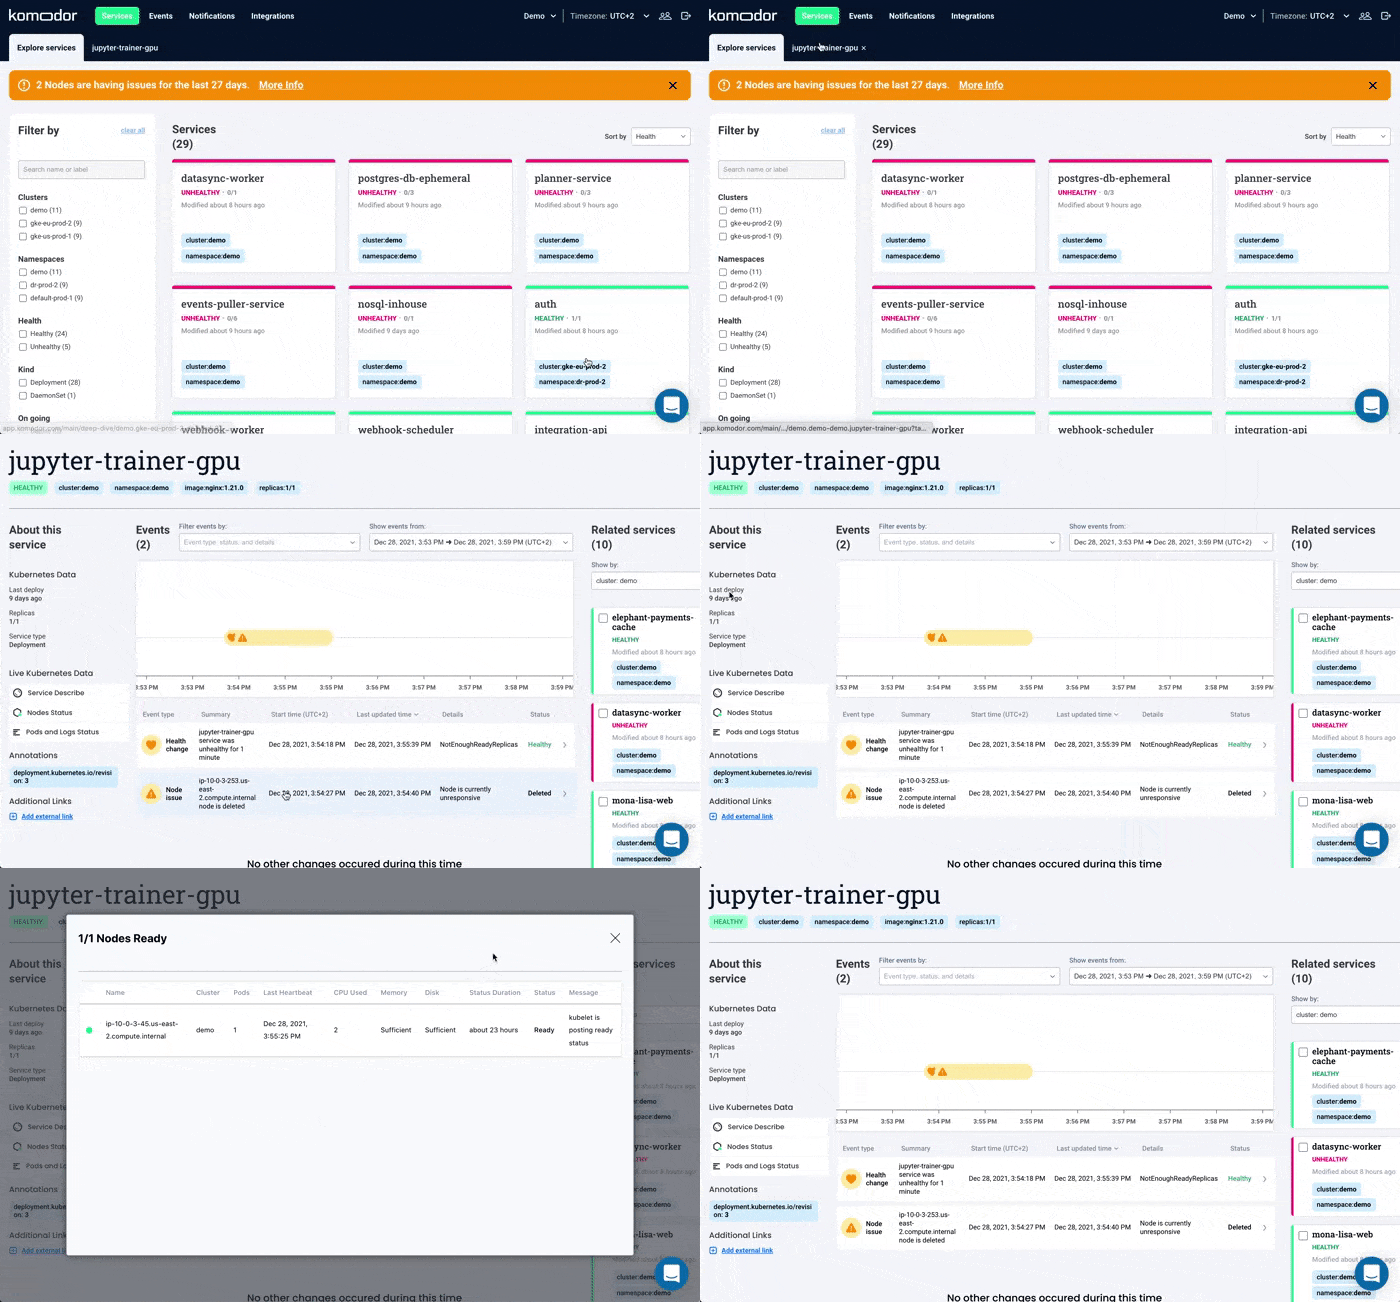
Komodor can help with our new ‘Node Status’ view, built to pinpoint correlations between service or deployment issues and changes in the underlying node infrastructure. With this view you can rapidly:
- See service-to-node associations
- Correlate service and node health issues
- Gain visibility over node capacity allocations, restrictions, and limitations
- Identify “noisy neighbors” that use up cluster resources
- Keep track of changes in managed clusters
- Get fast access to historical node-level event data

Beyond node error remediations, Komodor can help troubleshoot a variety of Kubernetes errors and issues, acting as a single source of truth (SSOT) for all of your K8s troubleshooting needs. Komodor provides:
- Change intelligence: Every issue is a result of a change. Within seconds we can help you understand exactly who did what and when.
- In-depth visibility: A complete activity timeline, showing all code and config changes, deployments, alerts, code diffs, pod logs and etc. All within one pane of glass with easy drill-down options.
- Insights into service dependencies: An easy way to understand cross-service changes and visualize their ripple effects across your entire system.
- Seamless notifications: Direct integration with your existing communication channels (e.g., Slack) so you’ll have all the information you need, when you need it.
If you are interested in checking out Komodor, use this link to sign up for a Free Trial.


